Bible Publisher Overview

Insights allow you to view aggregated data about your Plans and Bible Versions, and how users are interacting with them. You can also view YouVersion Trends to see how the larger YouVersion Community is engaging with Scripture.
Important: Data displayed for Insights isn't real-time. There's a 2-day lag.
What you can see in Insights:
- Plan subscriptions and completion rates.
- Historical charts showing trends for your content.
- The 90-day chart displays weekly subscription totals, while the 12-month chart shows monthly totals.
- Percentage differences for the past week and year-over-year comparisons.
- Engagement trends including (highlights, verses shared, offline downloads, and chapter requests).
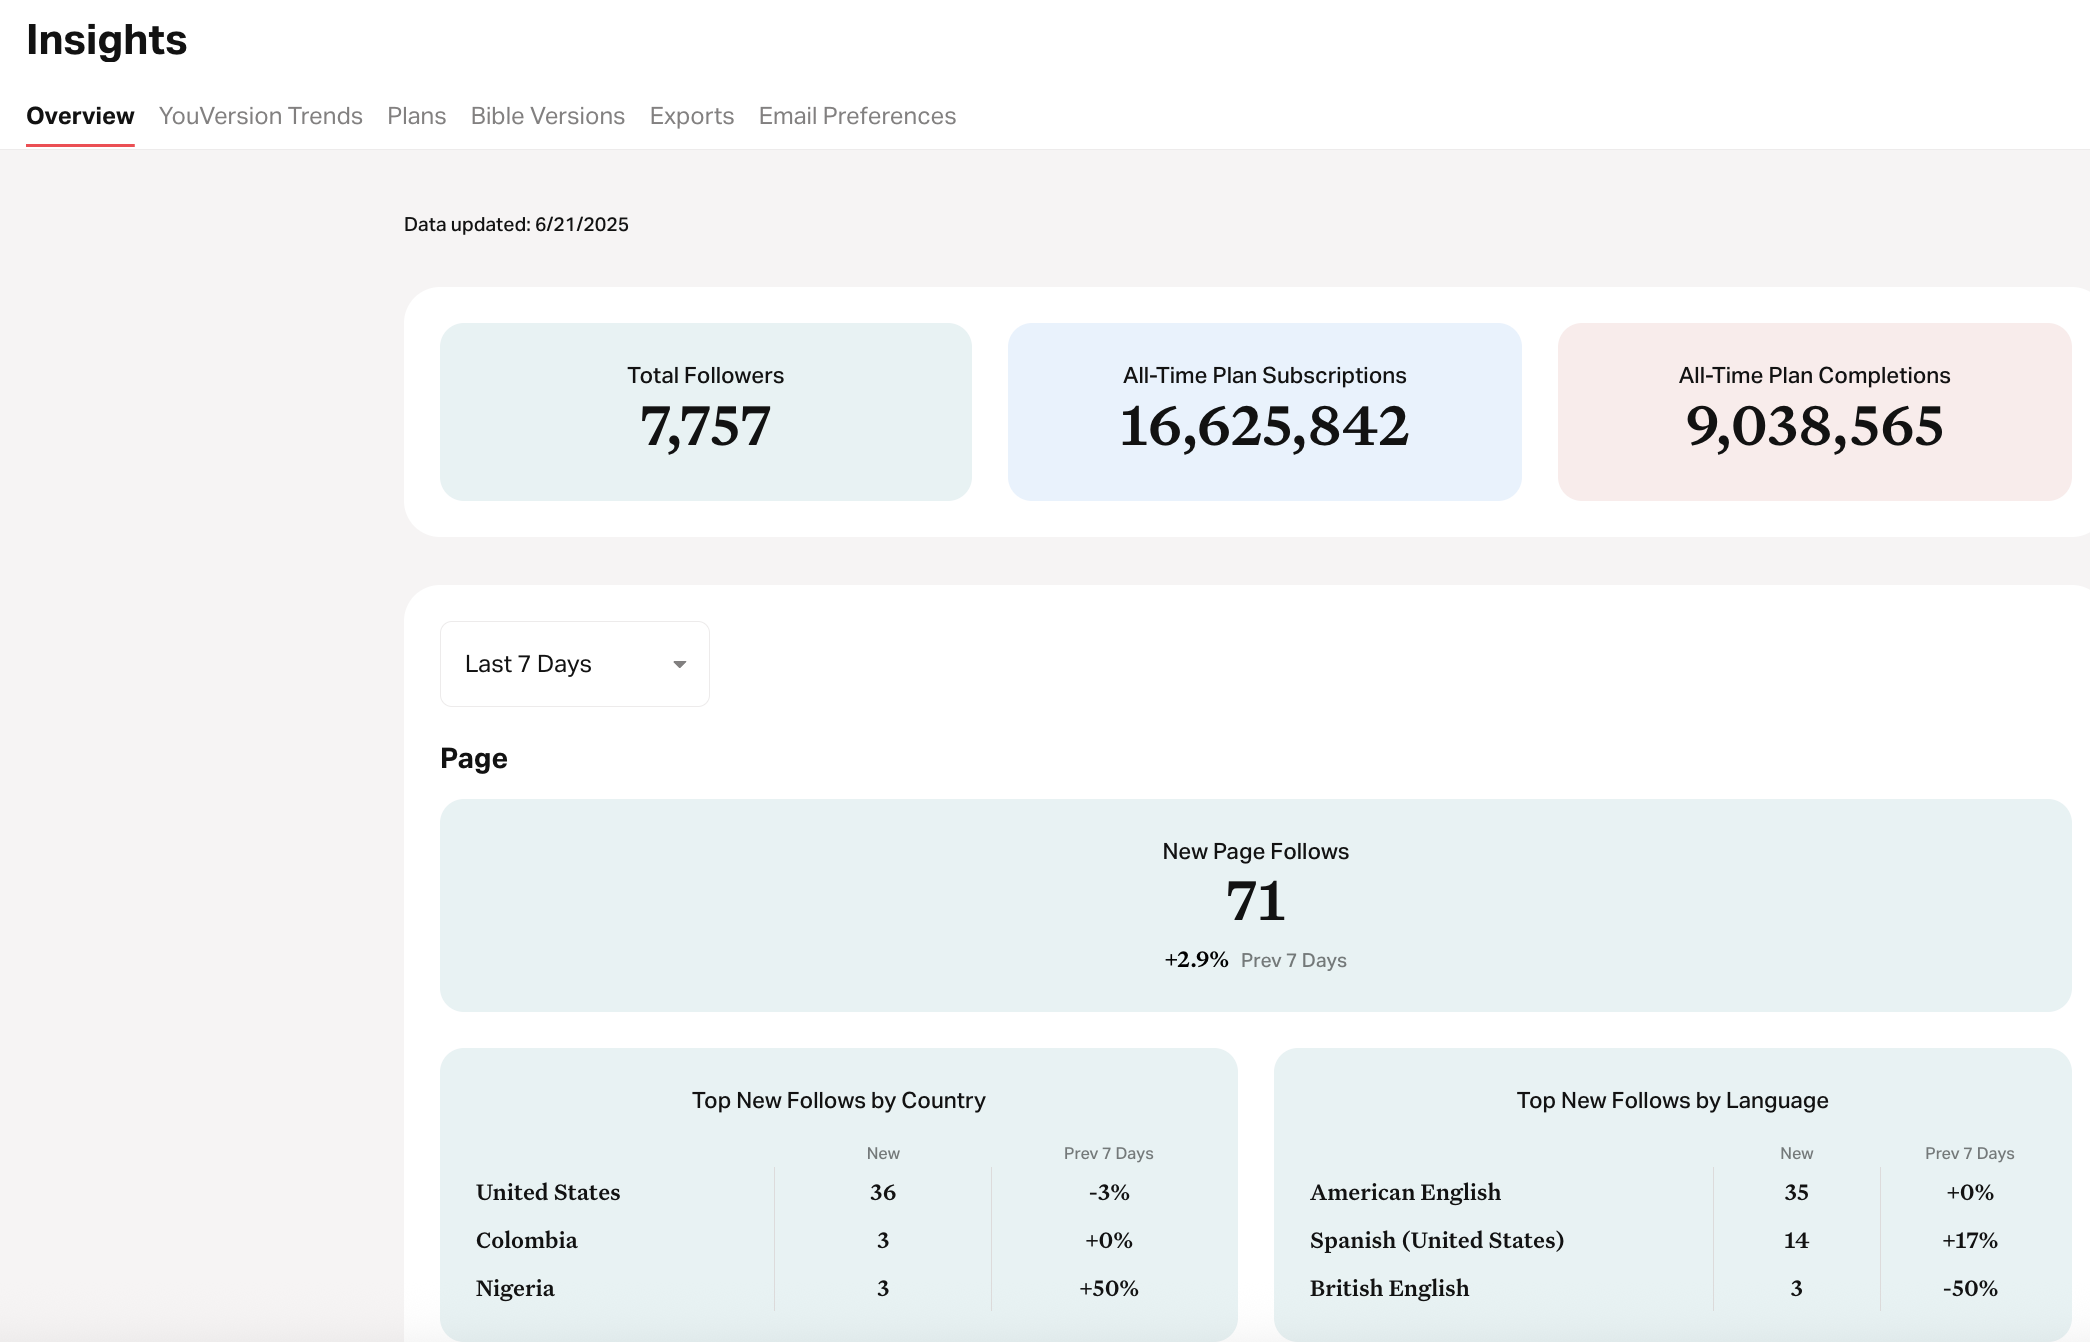
- Page follows (this is the number of users who have followed your page).
- Top follows by country/language.
Data around Video content is currently not available. If you are primarily a Video Partner, you will get access to YouVersion Trends, but not data around videos.